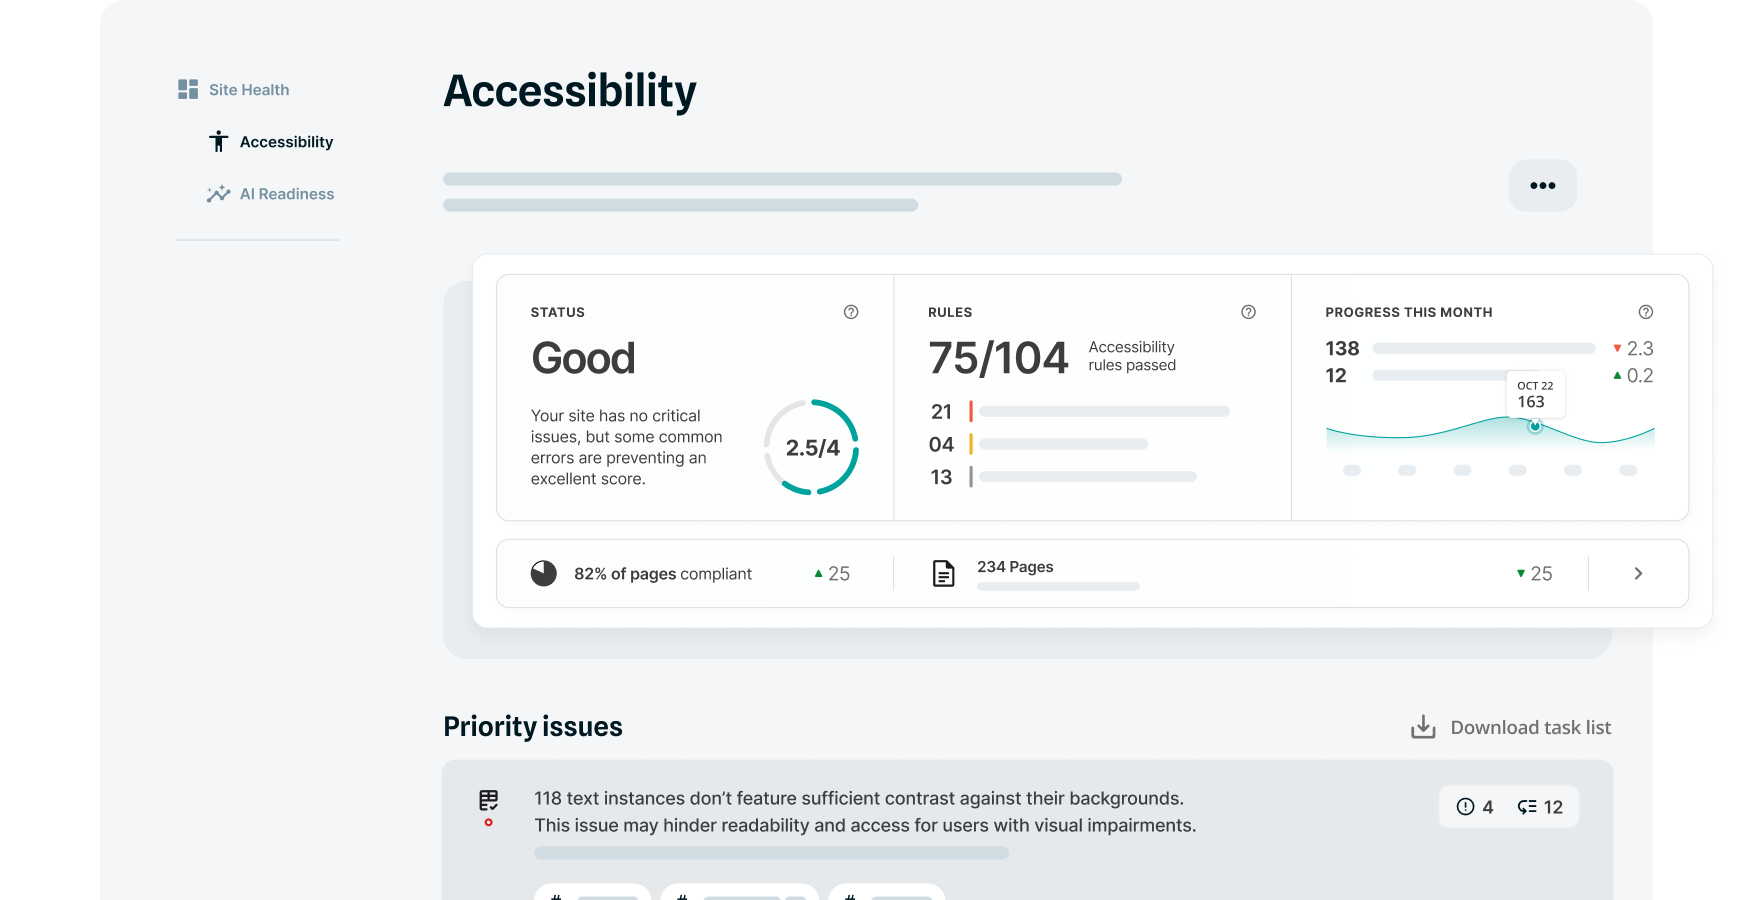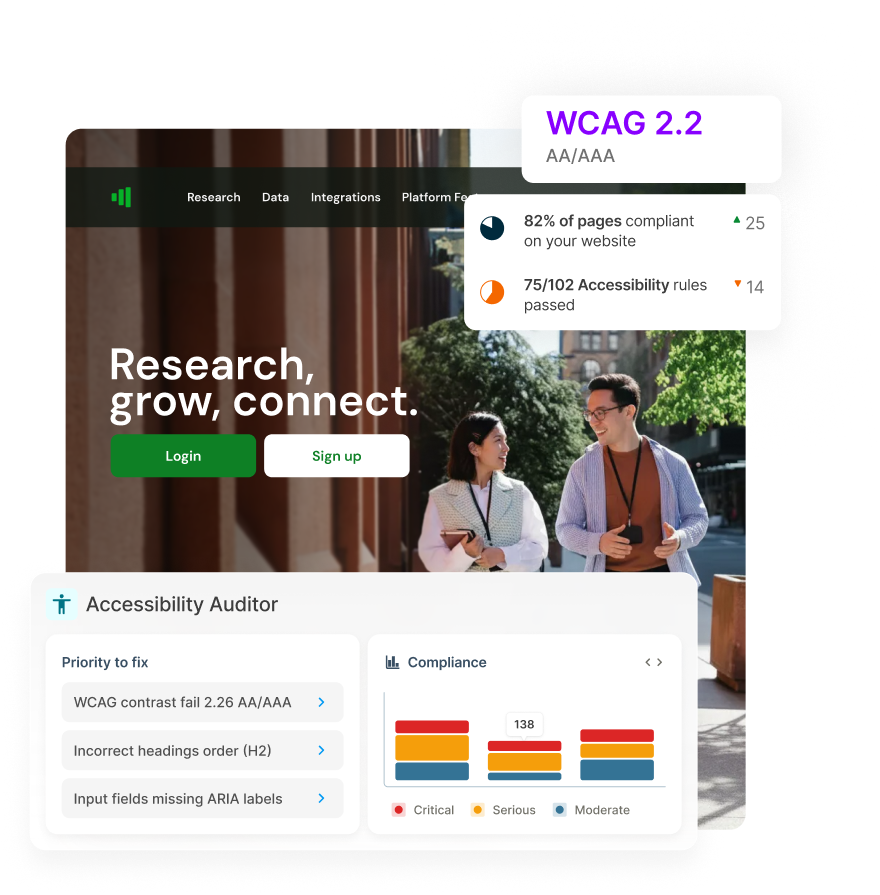
See your accessibility health at a glance
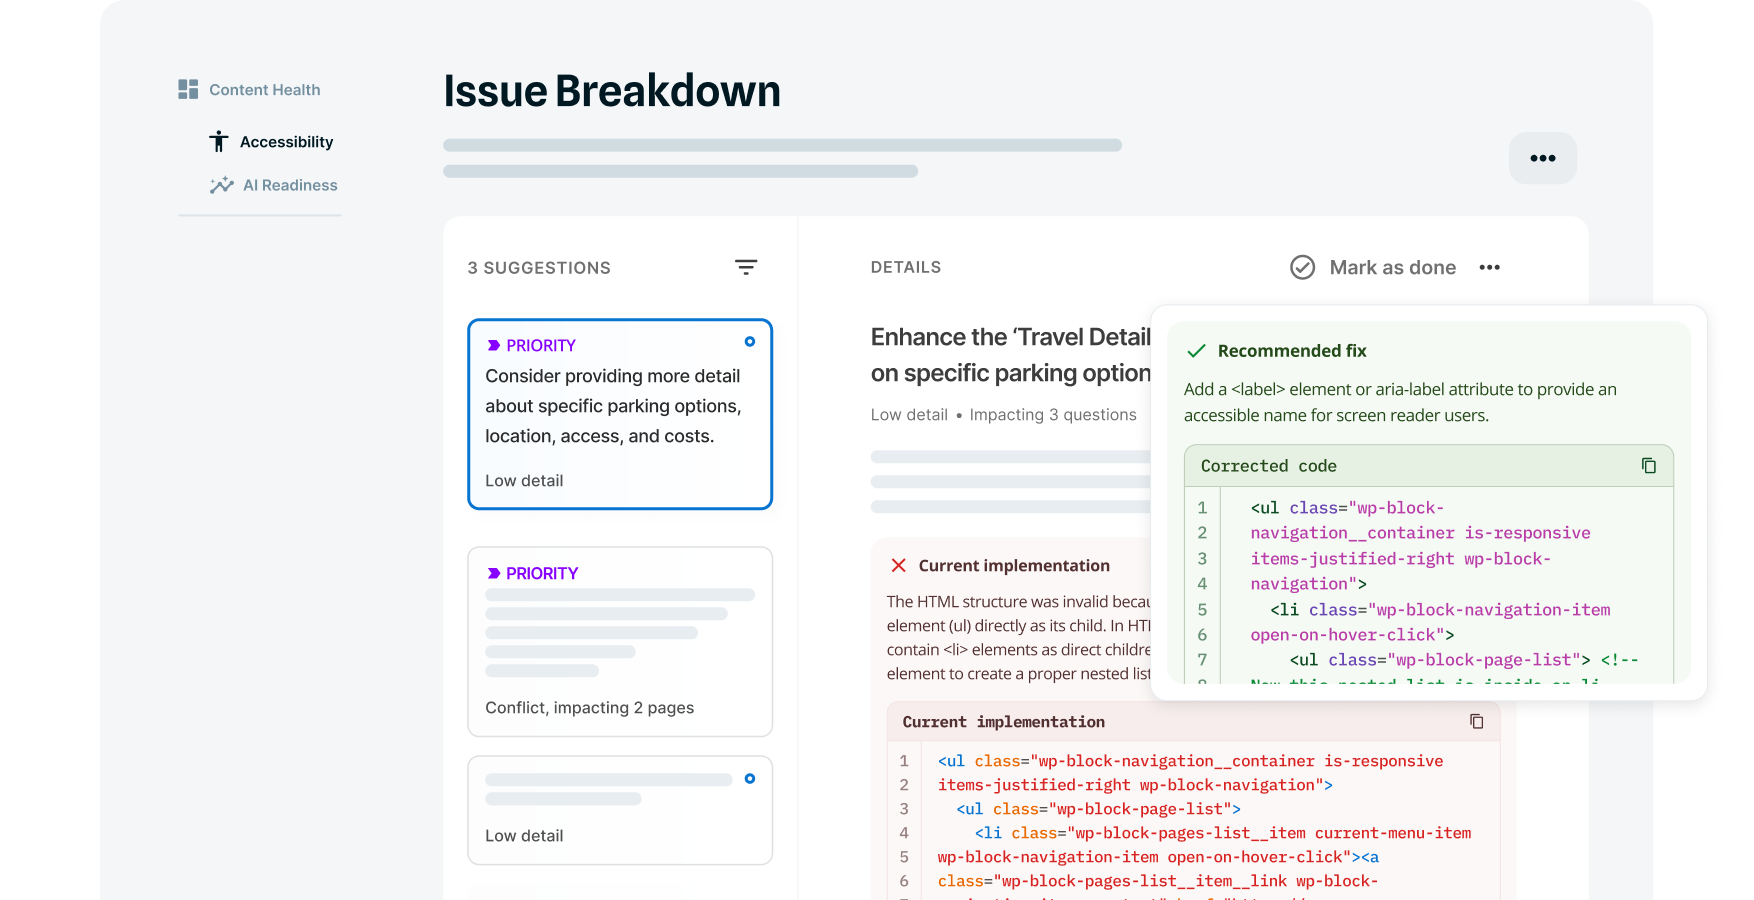
A single score tracks where you stand based on how many accessibility issues exist, how critical they are, and which standards they affect. Visual graphs show which problems have been resolved and which are new, turning raw data into trends you can actually understand.