

Create and launch tests in minutes
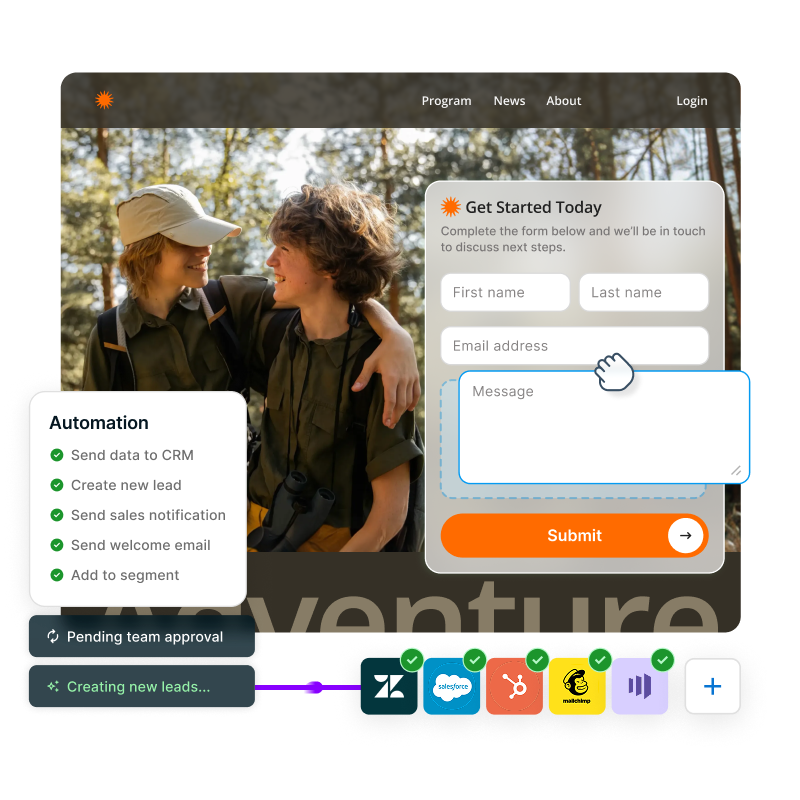
Build test variations using the same visual page builder your team uses for content. Test headlines, images, CTAs, and more, using AI-powered prompts to instantly generate variant copy. No tickets or code required.

Give your marketing team the power to run A/B tests, map customer journeys, and refine what's working, so every visit delivers better outcomes.
Build test variations using the same visual page builder your team uses for content. Test headlines, images, CTAs, and more, using AI-powered prompts to instantly generate variant copy. No tickets or code required.
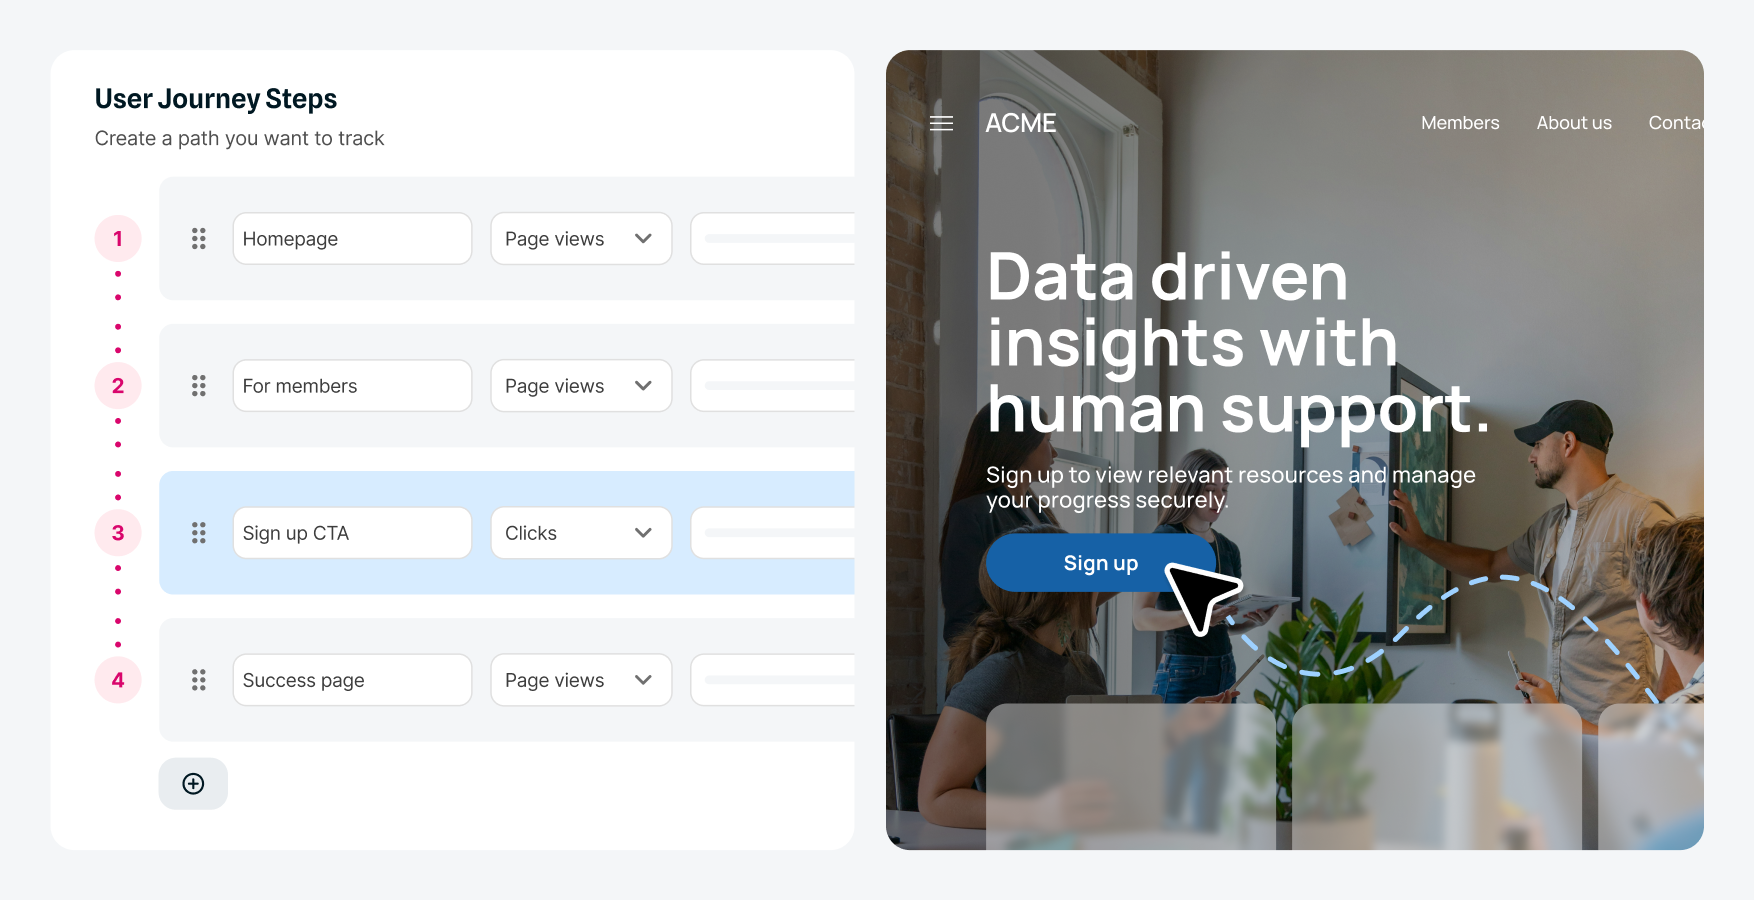
Visualize how different segments move through your site and see where they abandon their journey. Identify which pages create friction, so you can focus your testing and optimization efforts where they'll have the biggest impact on conversion.
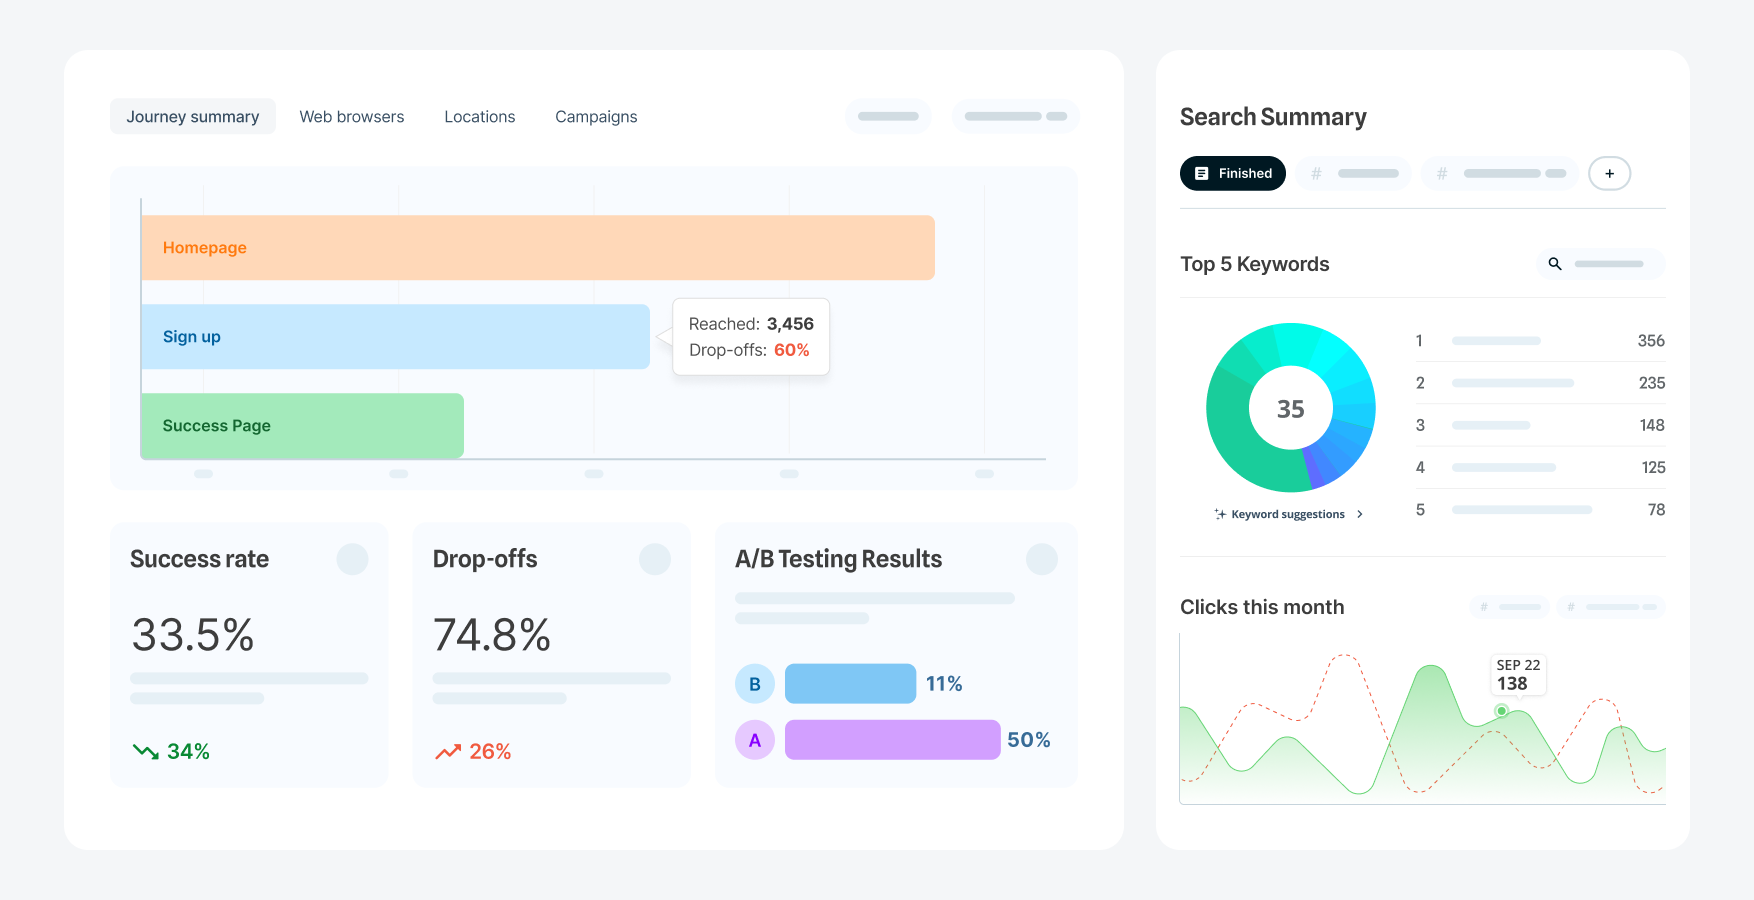
See which variation performs better while tests are running. Track metrics including conversion rate and funnel drop-off points across segments. Monitor statistical significance in real time and compare variation performance. Easy access to analytics lets you act on insights quickly rather than waiting for quarterly reports.
Video: See behavioral analytics in action. Captions and transcript available on playback.
See how non-technical teams can identify conversion problems, test solutions, and measure the impact, all without developer involvement.

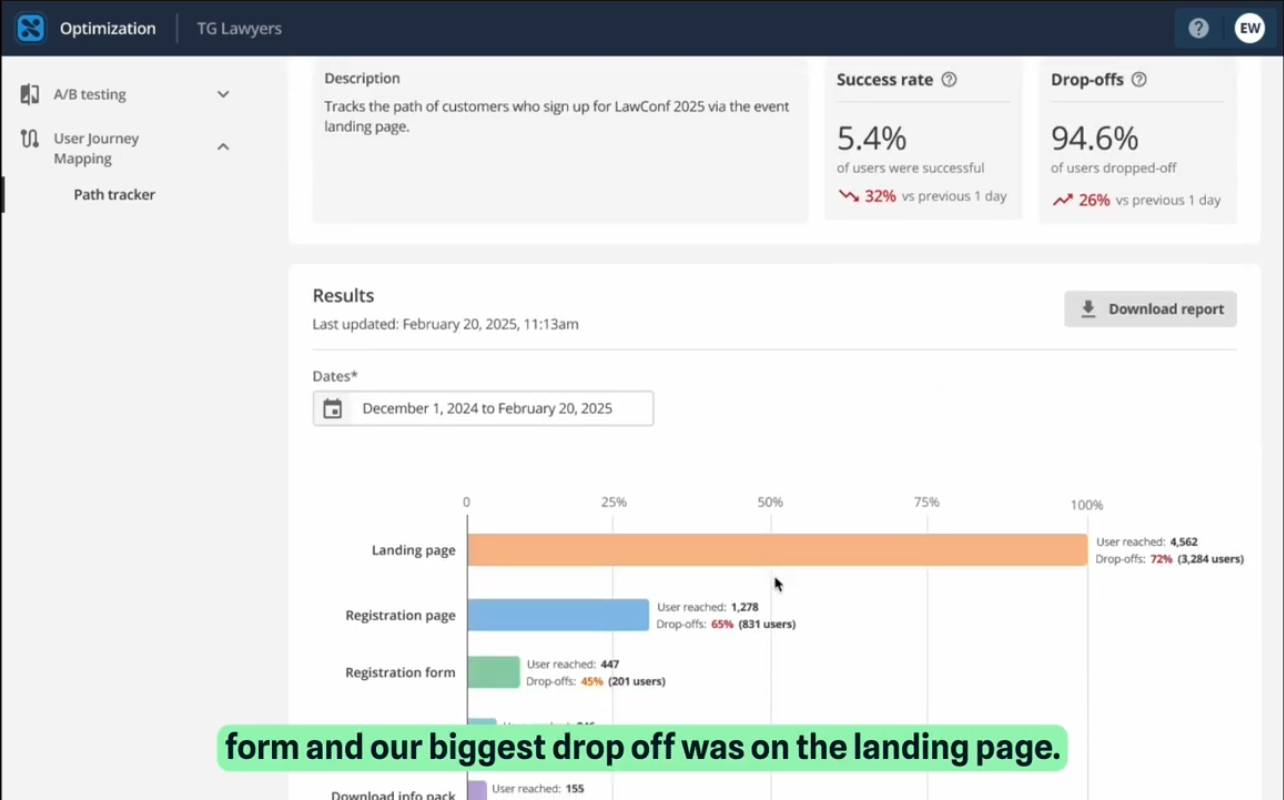
Explore how to optimize an event registration page from start to finish. Just one example of what you can do with built-in testing, personalization, and analytics.
You can A/B test any component or element on a page: headlines, subheadings, body copy, images, CTAs, button text, form fields, page layouts, and more. If you can edit it in the CMS, you can create a test variation. This flexibility means you're not limited to simple headline tests; you can test completely different approaches and creative variations.
Most websites with at least several thousand visitors per month have sufficient traffic for meaningful tests. Our A/B testing feature includes a built-in calculator that recommends the ideal test duration based on your traffic and conversion goals, so you know how to set up each test for statistically significant results. Focus on high-impact pages first, like your homepage, product pages, or lead capture forms, where even modest improvements drive significant results. Even sites with lower traffic can benefit significantly from journey mapping, which doesn't require high traffic thresholds but still helps you understand user behavior and identify optimization opportunities.
It can. Enterprise experimentation platforms can cost tens of thousands per year, depending on traffic and features. Behavioral Analytics is included with your DXP subscription, integrates natively with the CMS, and eliminates context switching between separate interfaces. If you currently pay for other testing platforms, you can likely eliminate those costs while gaining faster testing velocity.
This really depends on your traffic volume and test goals. High-traffic pages can show statistically significant results in days, while lower-traffic pages might take 2-4 weeks. Our built-in calculator recommends the ideal test duration when you set up each test, taking the guesswork out of timing.
Squiz DXP's native Behavioral Analytics capability can be used in isolation or to complement your existing analytics stack. You can continue to use Google Analytics (GA4) for site-wide analytics.
No. The Behavioral Analytics capability is part of our integrated, composable Digital Experience Platform (DXP), alongside other capabilities such as Personalization, Optimization and CMS.
This unified approach allows teams to manage their entire digital experience inside one platform, while also scaling their usage as they need to.