✨ NEW Content Intelligence is here! Make your content unmissable to AI search
Squiz experience monitoring example interface

Experience monitoring

Monitor technical issues across all your domains. Catch 404 errors, slow-loading pages, and performance problems before they impact visitors or search rankings.

See performance the way your visitors do

Small technical issues can quietly hurt engagement, trust, and search visibility. Slow pages, broken links, or caching problems often go unnoticed until conversions drop or complaints start rolling in.

Experience monitoring gives you a clear view of what’s really happening. It helps you uncover 404 errors, understand page load time, see low cache hit ratio, assess file sizes and more, so you can act quickly and confidently.

Proactive monitoring for better site performance

Icon Octagon

Catch problems before they impact users

Performance issues and 404 errors damage trust and SEO rankings. Stay ahead with hourly updates so you can fix issues before complaints roll in.

Icon Settings

Manage site health at scale

Monitor all your domains from one platform to spot patterns, identify problems, and keep every site running smoothly.

Icon Checklist

Prioritize fixes with data

Identify which technical issues impact user experience most and prioritize fixes that deliver measurable results.

Tools to help you track and resolve issues

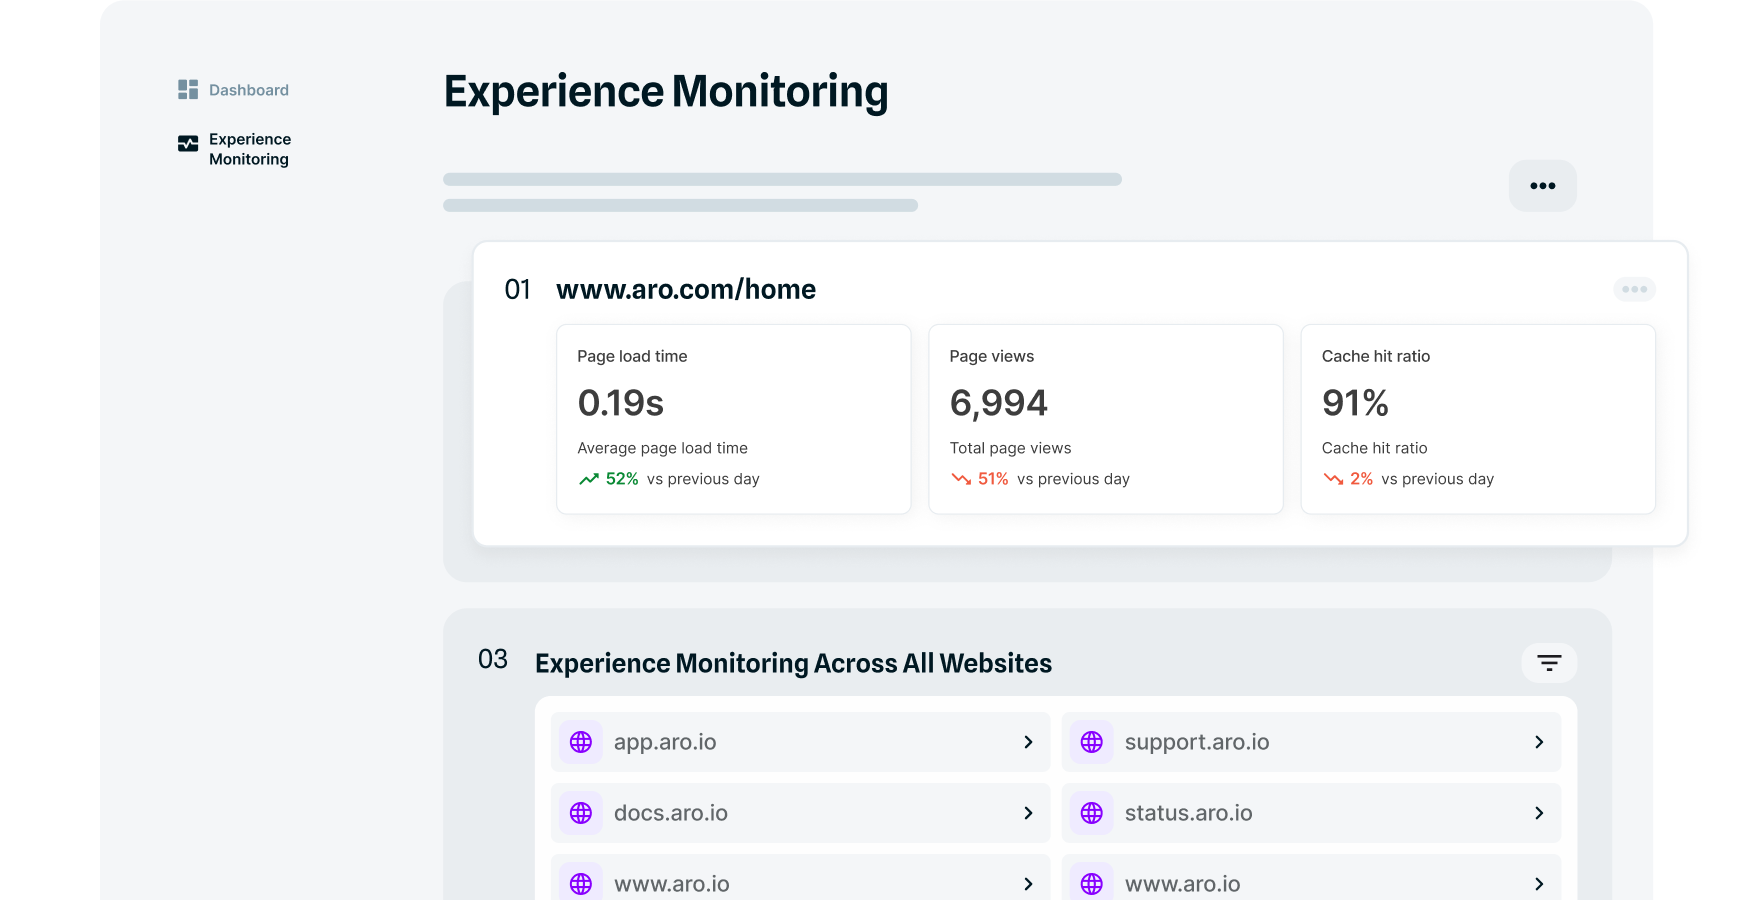
Centralized site monitoring across all domains

Access all your sites from one place. Drill into any domain to see comprehensive user performance data alongside automated system checks like page load times, cache usage, file sizes, 404 errors, and most popular pages. View site statistics and trend information to understand how performance changes and which problems need immediate attention.

Example Squiz interface centralised content monitoring

✔️ Spot patterns with date range filtering

Filter monitoring data by single date or date range to identify performance trends. See how site health evolves over time, catch recurring issues before they become critical, and validate if fixes actually deliver lasting results.

✔️ Monitor by problem type

Category tabs group technical issues for faster diagnosis and resolution. Monitor page load times to identify slow pages, track file sizes that impact performance, catch 404 errors before users do, analyze cache usage efficiency, and more. Prioritize fixes based on actual data rather than guessing which problems matter most.

Frequently asked questions 

The experience monitoring tool tracks key performance indicators that affect user experience: page load times, file sizes, 404 errors, cache usage, as well as which pages get the most traffic. You can view each category separately to focus on specific issues. Find out more here.